Global Climate Dashboad
Methane Emission
What is Methane Emission?
Methane emissions are the release of methane gas into the air. Methane is a powerful greenhouse gas that comes from both natural sources, like wetlands, and human activities, such as farming, fossil fuel extraction, and waste management. When methane is released, it traps heat in the atmosphere, contributing to global warming and climate change.

About
In 2019, scientists tracked global methane emissions using satellite data. Methane is produced by both natural sources like wetlands and human activities such as farming, fossil fuel extraction, and waste disposal.
.jpeg)
In 2019, scientists tracked global methane emissions using satellite data. Methane is produced by both natural sources like wetlands and human activities such as farming, fossil fuel extraction, and waste disposal.

Using an advanced model, researchers measured these emissions and found that certain sources, like aquatic areas and fossil fuel extraction, may emit more methane than previously believed.
.jpeg)
There are still uncertainties in accurately tracking methane emissions, but new techniques have made the data more reliable. This helps countries understand their greenhouse gas emissions better and develop strategies to reduce them, slowing down climate change.
Methane emissions are measured in megagrams per square kilometer per year (Mg CH₄/km²/yr) and cover over 25 categories like agriculture, petroleum, natural gas systems, coal mining, and waste.
These methane emissions align with the national annual data from the US GHGI and are designed for easy exploration using Cloud-Optimized GeoTIFFs. The dataset includes annual methane emissions measured at the molecular level.

The US Environmental Protection Agency (EPA) published a detailed methane greenhouse gas inventory (GHGI) for the contiguous United States from 2012 to 2020, with high-resolution maps showing emissions at a 10 x 10 km scale.
Between 2012 and 2020, the EPA developed precise methane emission maps for the United States, showing emissions from agriculture, gas, oil, coal, and waste. These maps help scientists pinpoint where most methane comes from across the country.
Global methane emissions from vegetated wetlands have been tracked daily and monthly since 1990, using a spatial resolution of 0.5° x 0.5°. The LPJ-EOSIM Wetland Methane Emissions model estimates methane based on factors like soil moisture, temperature, and carbon content.
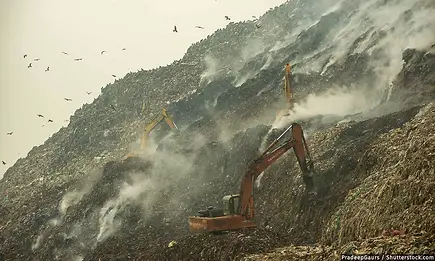
This wetland dataset is updated every two months and plays a crucial role in understanding global methane levels. It is integrated with NASA’s Goddard Earth Observing System (GEOS) to improve predictions of how methane emissions affect the atmosphere.